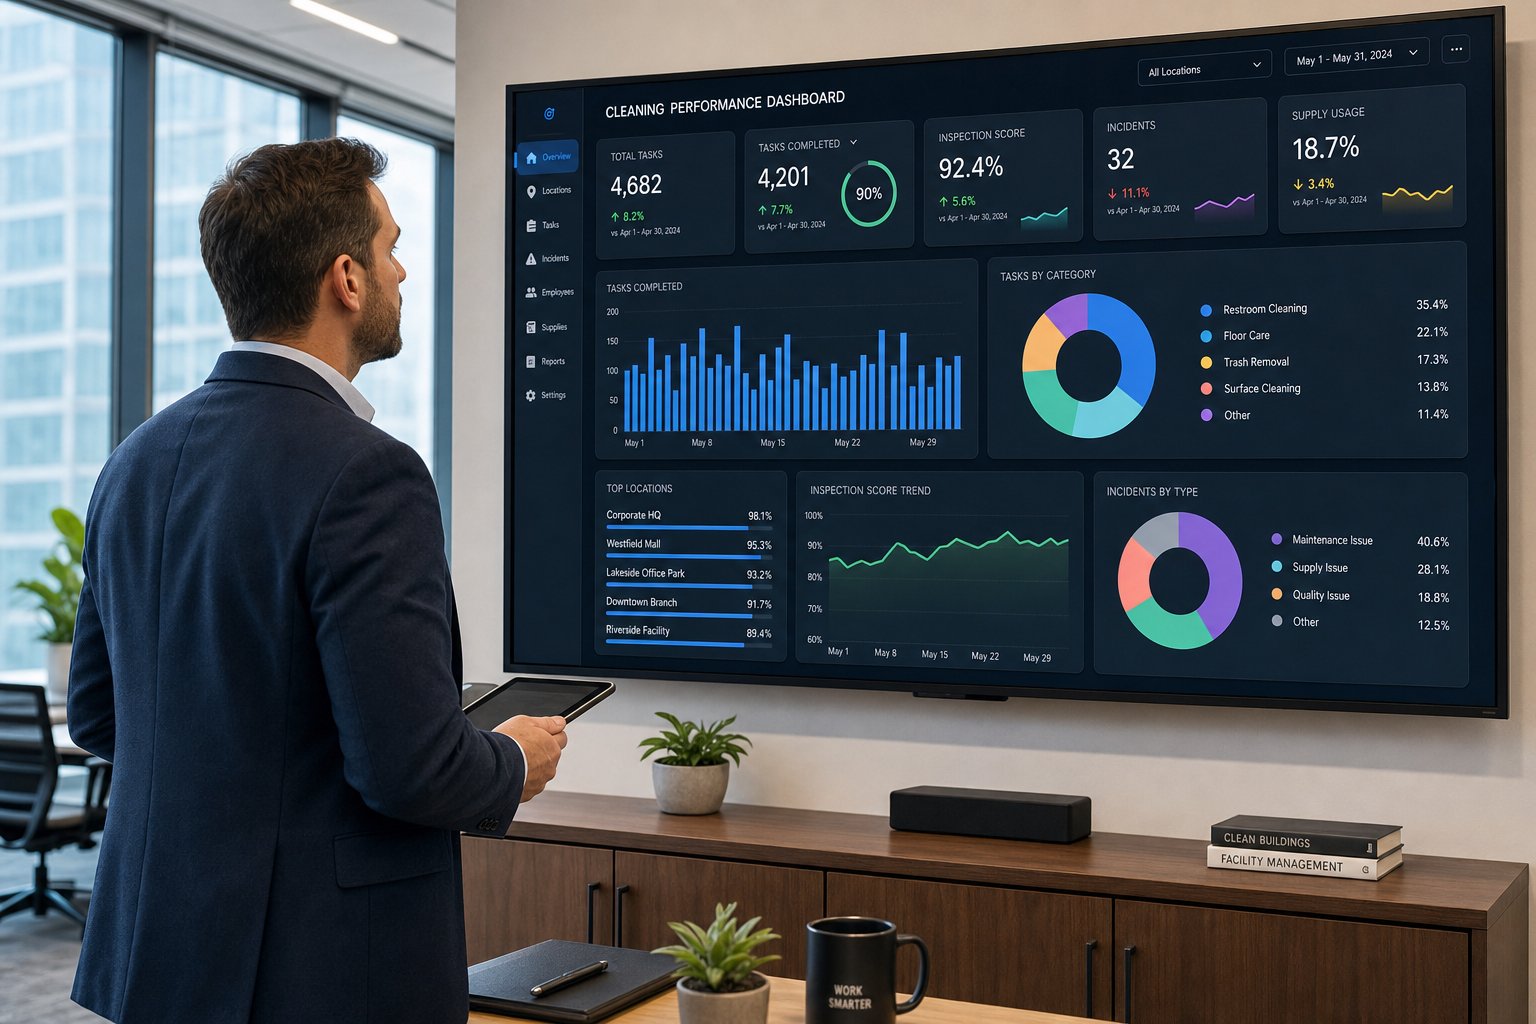
Most cleaning programs fail quietly: complaints rise, restrooms slip, and leadership only notices when tenants threaten to leave. A monthly KPI dashboard prevents that by turning cleaning into measurable operations. GreenPoint Maintenance Services builds KPI dashboards for facilities across NYC, Westchester, Long Island, New Jersey, Connecticut, and Pennsylvania—using verified task completion, inspection scores, and objective hygiene testing where it matters. If you want GreenPoint to build a KPI dashboard tied to your scope and building traffic, call 347-332-9348 for a walkthrough and quote.
What makes a cleaning KPI ‘real’ (and not vanity reporting)
A useful KPI has three properties: it is measurable, it is tied to a controllable process, and it predicts outcomes (complaints, retention, safety incidents). Vanity metrics—like ‘hours scheduled’—do not tell you whether high-touch surfaces were disinfected or whether the trash rooms stayed compliant. GreenPoint focuses on KPIs that connect directly to service level, risk, and cost.
For evidence, we recommend digital verification so the dashboard is not just self-reported. GreenPoint uses JaniTrack to record time-stamped completion and photo verification, and we can incorporate ATP testing results for hygiene validation on critical touchpoints. For an overview of verification methods, see: [Digital Cleaning Verification Systems](/blog/digital-cleaning-verification-systems/).
KPI #1–#3: Completion, on-time rate, and missed-task recovery
1) Task completion rate: percent of scheduled tasks completed per shift and per zone. Target: 98–100% for critical tasks (restroom service, trash removal), and 95%+ for non-critical tasks. 2) On-time completion rate: tasks completed within the scheduled window, especially for daytime porters. 3) Missed-task recovery time: how quickly a missed task is corrected once detected. These three metrics tell you if the program is executed reliably.
In commuter-heavy buildings near major hubs, timing matters as much as completion. A restroom that is cleaned at 9:00 PM does not prevent a 2:00 PM complaint. GreenPoint dashboards break these KPIs down by time window (morning/lunch/afternoon) so you can align staffing to demand.
KPI #4–#6: Inspection scores, defect density, and repeat defects
4) Inspection score: average score from structured inspections (e.g., weekly manager inspection plus monthly client walkthrough). 5) Defect density: number of defects per 10,000 sq ft or per floor—this normalizes scores across properties. 6) Repeat defect rate: percent of defects that reappear in the same location within 30 days. Repeat defects point to training gaps, worn equipment, or unclear scope.
GreenPoint ties defects to root causes: staffing coverage, supply availability, and equipment condition. If you want a checklist-style inspection model, our [Cleaning Audit Checklist for Facility Managers](/blog/cleaning-audit-checklist-facility-managers/) post is a strong starting point.
KPI #7–#8: Complaint rate and response time (the tenant experience layer)
7) Complaint rate: complaints per 100 occupants (or per 10,000 sq ft) each month. The raw number is less important than trend and location patterns. 8) Response time: median time to resolve a request (spill, restroom restock, conference room reset). For multi-tenant offices in Manhattan and Downtown Brooklyn, quick response is a major retention driver.
GreenPoint recommends categorizing requests by severity: safety (biohazard, slip risk), hygiene (restrooms, break rooms), and cosmetic (dust, smudges). That lets you set service-level targets and measure whether staffing and supplies support those targets. Call 347-332-9348 to align your KPI targets to your building’s tenant profile.
KPI #9: Consumables variance (restroom supplies as an operational metric)
Restroom supplies are part of cleaning performance. Track monthly usage of tissue, towels, liners, and soap against a baseline. Variance beyond a threshold (often 15–20%) signals over-dispensing, dispenser issues, theft, or traffic changes. This KPI also strengthens budget forecasting and reduces surprise invoices.
If your building struggles with stockouts or overspend, build a par-level program and track it as KPI #9. Our operations guide [Restroom Paper and Supply Management](/blog/restroom-paper-and-supply-management-cleaning/) pairs well with this dashboard.
KPI #10: Hygiene validation (ATP pass rate for critical touchpoints)
Inspection scores are subjective; ATP testing adds objective hygiene data. KPI #10 is ATP pass rate (or average RLU) for defined touchpoints: restroom door pulls, faucet handles, break room counters, elevator buttons, and fitness equipment grips. GreenPoint can set thresholds and sampling plans so results are comparable month to month. ATP is not needed everywhere, but for high-risk areas it turns “it looks clean” into measurable cleanliness.
If you are new to ATP, start with a pilot: 10–20 swabs per month focused on the highest-traffic zones. Over 90 days, you will see which areas fail consistently and can adjust training and dwell times accordingly. For deeper background, see: [What is ATP Bioluminescence Testing in Cleaning?](/blog/what-is-atp-bioluminescence-testing-cleaning/).
KPI #11–#12: Staffing stability and training completion
11) Staffing stability: turnover rate and vacancy days. High turnover drives inconsistent quality and increases rework. 12) Training completion: percent of staff current on core modules (chemical safety, restroom protocols, floor care basics). These metrics are especially important for regulated environments like medical offices and schools where OSHA chemical safety and NYC DOE expectations matter.
GreenPoint invests in repeatable training and proof-driven supervision, which supports our 98% client retention. If your dashboard shows chronic vacancy or training gaps, the corrective action is often better supervision and a clearer scope—not more inspections.
How to present the dashboard to leadership (and get budget approved)
Executives want risk reduction and predictability. Present KPIs in three buckets: Service reliability (completion/on-time), tenant experience (complaints/response), and risk control (ATP pass rate, chemical safety compliance). Add one cost slide: cost per square foot and how defects drive rework and overtime. This structure turns cleaning from a line item into operational control.
GreenPoint can provide monthly KPI reporting as part of our program, including JaniTrack verification and site-level trend analysis. To set up your first 30-day baseline, call 347-332-9348 or email info@greenpointms.com.
FAQ: cleaning KPIs for facility managers
Q: How many KPIs should I track? A: Track 8–12 core metrics. Fewer misses issues; more becomes noise. GreenPoint’s 12-KPI model covers execution, quality, and risk.
Q: What is a good complaint rate? A: It depends on occupancy and public access. The goal is trending down and clustering by location. Normalize complaints per 100 occupants or per 10,000 sq ft.
Q: Do I need ATP testing? A: Not for every building, but it is valuable for high-touch, high-risk zones (medical, fitness, dense offices). Start small with a pilot and track pass rate over time.
Q: How do you verify tasks were actually done? A: Use digital verification. GreenPoint uses JaniTrack for time-stamped, GPS-tagged verification and photo evidence, creating an audit trail.
Q: How quickly can we implement this dashboard? A: Typically within 30 days: define scope, set inspection rubric, establish baseline, then report monthly trends. Call 347-332-9348 to get started.
Ready for a cleaning program you can manage by numbers—not complaints? GreenPoint Maintenance Services will build a monthly KPI dashboard with JaniTrack verification and optional ATP hygiene validation. Call 347-332-9348 or email info@greenpointms.com to schedule a walkthrough and fixed-price quote.