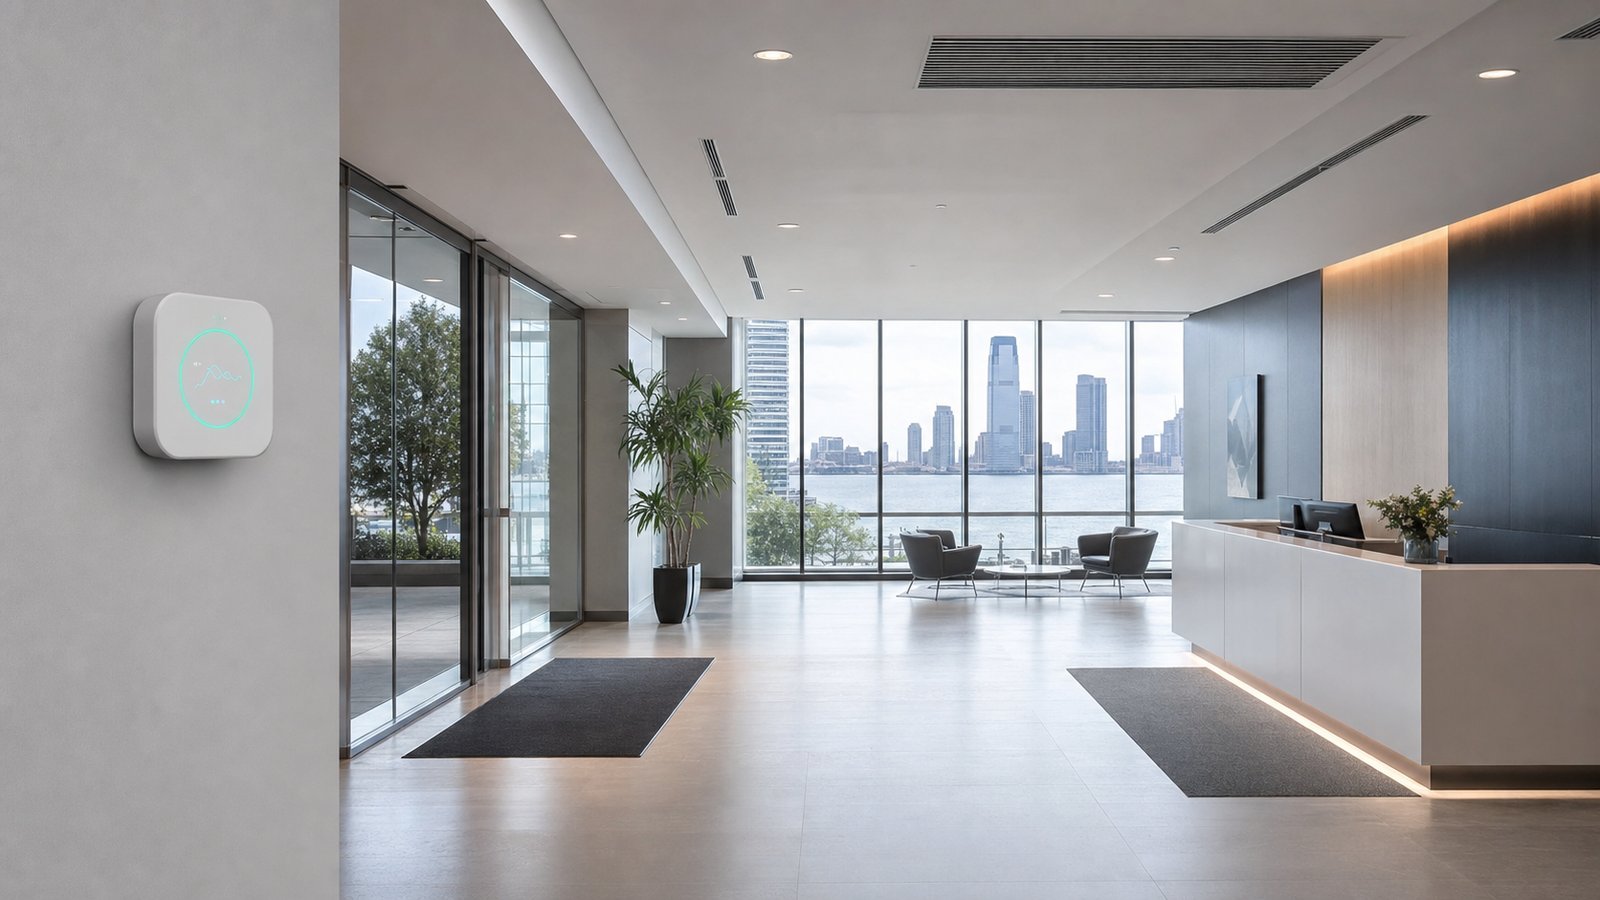
Indoor air quality (IAQ) is now a board-level topic for many Jersey City properties—especially offices near transit (PATH stations), healthcare suites, and multi-tenant buildings where complaints travel fast. IoT air quality sensors can help, but only if you connect the data to a cleaning plan that changes what happens on the floor. This “IoT air quality sensors Jersey City” guide shows how to translate CO2, PM2.5, and VOC trends into actionable cleaning schedules, filtration support, and measurable KPIs. GreenPoint Maintenance Services pairs data-driven programs with proof: StockPoint verification (time-stamped GPS-tagged photos) and optional ATP testing. For a walkthrough and fixed-price quote, call 844-814-0810.
What IAQ sensors can and cannot prove about cleaning
IAQ sensors measure air conditions, not “cleanliness” directly. CO2 is mainly a ventilation/occupancy signal; PM2.5 can reflect outdoor infiltration, construction dust, or indoor activity; VOC readings can spike from products, furnishings, or certain cleaning chemicals. The value is pattern detection: if complaints correlate with certain zones or times, you can adjust cleaning frequency, entry mat maintenance, filter change timing, and product selection. GreenPoint treats IAQ data as a feedback loop—measure, adjust, verify, and report.
Jersey City realities: traffic, waterfront wind, and construction dust
Jersey City buildings often experience dust load from ongoing development, plus outdoor particulate intrusion depending on wind patterns along the waterfront. PATH-adjacent properties see heavy foot traffic and door cycling that brings in soil and particulates. A practical first step is zoning: lobby/entry, elevator banks, fitness/amenities, corridors, and restrooms. Each zone gets an IAQ “watch list” and cleaning actions tied to trends (for example, increasing HEPA vacuuming in corridors after a multi-day PM2.5 rise).
KPIs that get quoted: thresholds, response time, and verification
To make IAQ useful for operations, define a small set of KPIs. Example framework: (1) PM2.5 trend alerts when a zone stays elevated for 60+ minutes, triggering targeted dust-control cleaning; (2) VOC spike review after product changes, prompting a switch to Green Seal-certified products; (3) complaint response SLA (e.g., investigate within 2 hours during business days); (4) verification rate—percentage of planned tasks documented with time-stamped photos. GreenPoint reports these KPIs monthly and ties them to route completion proof via StockPoint.
Cleaning actions that meaningfully support better IAQ
Most IAQ gains come from dust and particulate control: HEPA filtration vacuuming (carpet and hard floors), microfiber systems that trap particles, and entryway mat programs that reduce soil tracked indoors. Restroom odor issues can also drive VOC perceptions; consistent restroom protocols reduce complaint volume (see [restroom cleaning best practices for high traffic](/blog/restroom-cleaning-best-practices-high-traffic/)). For buildings targeting sustainability goals, product selection matters—GreenPoint uses Green Seal-certified products where appropriate and documents the product list for stakeholders.
Linking sensor data to a cleaning schedule (a practical workflow)
GreenPoint’s recommended workflow is simple: (1) establish a 2-week baseline for each zone, (2) identify the top 3 recurring patterns (morning CO2 rise, afternoon PM spikes, weekly VOC events), (3) map cleaning tasks to each pattern, and (4) run a 30-day “measure-and-adjust” cycle. Example: if afternoon PM2.5 rises in corridors, add an extra HEPA vacuum pass and a damp microfiber dusting cycle on high ledges every other day. If VOC spikes track to a specific floor product, substitute an approved low-VOC cleaner and document the change.
Verification and reporting: why proof is required for multi-tenant buildings
In multi-tenant Jersey City buildings, perception can become politics. You need evidence: what was cleaned, when, and by whom. GreenPoint Maintenance Services uses StockPoint to provide time-stamped, GPS-tagged photos and completion logs, which makes monthly IAQ/operations reporting defensible. When hygiene sensitivity is higher (medical offices, childcare), we can add ATP testing to validate surface cleanliness. Learn more about verification systems in [digital cleaning verification systems](/blog/digital-cleaning-verification-systems/).
Product safety and OSHA-aligned chemical handling
If VOC readings rise after a product change, your team needs the discipline to identify the cause quickly. That includes correct labeling, SDS availability, and staff training—core OSHA hazard communication practices. GreenPoint standardizes GHS labels and SDS access and can help you audit product storage and use (see [OSHA cleaning chemical safety and SDS](/blog/osha-cleaning-chemical-safety-ghs-sds/)). This matters for compliance and for keeping occupant trust when you explain what changed and why.
FAQ: IoT air quality sensors and commercial cleaning in Jersey City
Q1: Can IAQ sensors prove a janitorial vendor is performing? A: Sensors show environmental trends; performance proof comes from combining data with task verification (photos, logs) and periodic audits. Q2: What’s the fastest cleaning change that helps IAQ? A: Improve particulate control—HEPA vacuuming, microfiber dusting, and a stronger mat program at entrances. Q3: Do green products always reduce VOC readings? A: Not always, but certified low-VOC products reduce risk; GreenPoint documents products and monitors sensor impacts after changes. Q4: How often should we review IAQ trends? A: Weekly during the first month, then monthly once the program stabilizes—unless alerts indicate a problem. Q5: How does GreenPoint report results to management? A: Monthly KPIs that include completion verification via StockPoint plus operational notes and recommended adjustments.
Get a data-driven cleaning walkthrough in Jersey City
If you already have sensors, GreenPoint can align your cleaning scope to what the data says, then verify execution with StockPoint. If you’re planning sensors, we can help define zones and operational KPIs so you don’t end up with dashboards that don’t change outcomes. Schedule a walkthrough and quote—call 844-814-0810 or email info@greenpointms.com. GreenPoint Maintenance Services provides fixed pricing, MBE/MWBE certification, and proof-driven QA with 98% client retention.
Want IAQ sensor data that actually improves daily operations? GreenPoint Maintenance Services builds a measurable program and verifies every critical task with StockPoint time-stamped GPS-tagged photos (and optional ATP testing). Call 844-814-0810 to schedule a Jersey City walkthrough and fixed-price quote—no hidden fees.